Before the home screen even mounted, the app spent a substantial share of its JavaScript time detecting formatting capabilities. The polyfill was still needed; its detection was disproportionately expensive. On the entry-level Android phone tested, fixing that detection alone reduced time to the milestone used at the time by 22%.
The investigation then crossed imports, store subscriptions, React rendering and Android compilation. Some fixes produced measurable gains; others exposed a problem in the protocol or shifted the wait to another step.
This engagement is anonymized. The examples explain the mechanisms without reproducing the application's code.
The stages of a React Native cold start on Android
A cold start begins with no process at all. In a React Native app, the time is split across these stages:
- Process creation. Android starts the process and creates the
Applicationobject. ItsonCreate()loads React Native's native libraries and often initializes several SDKs. - Activity and splash screen. The main activity is created while the system shows the splash screen.
- JavaScript runtime. Hermes loads the bundle. In release it is already compiled to bytecode, so there is nothing to parse, but every module imported at startup still executes, with its polyfills and side effects.
- First render. React renders the initial tree, React Native creates the native views and the activity draws its first frame: that is TTID (time to initial display).
- Usable screen. Session, profile, feature flags, home data: the screen fills in, often after network requests. When the app considers it ready, it calls
reportFullyDrawn(): that is TTFD (time to full display).
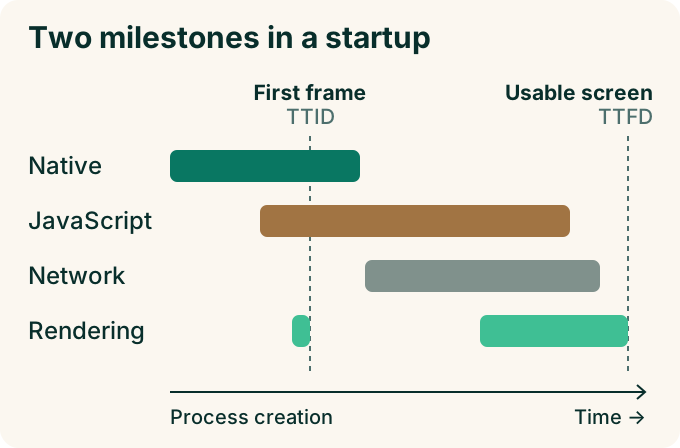
Conceptual diagram, not to scale. The precise milestone positions depend on the application.
These stages overlap: shortening one only moves the launch earlier if it was on the critical path. The Android startup documentation (opens in a new window) details both milestones.
For a first reading, adb shell am start -S -W -n <package>/<activity> stops the app, relaunches it and prints TotalTime, which matches TTID. It is useful for orientation, not for claiming a gain: the benchmark section explains why.
When Intl detection slows down startup
The first substantial cost was generic Intl.NumberFormat detection, particularly locale matching. I replaced it with checks for the formats the app actually used and reused formatter instances.
The tested devices still needed the fallback for some digit-grouping behavior. The improvement came from avoiding the detection path. Removing the polyfill would have made startup faster while displaying incorrect values.
Tests covered supported languages, separators, rounding, compact formats, currencies and language changes. A formatter cache must track both locale and options.
I addressed Intl.PluralRules separately. Hermes does not provide it: the polyfill is still required, and loading it directly avoids expensive detection. FormatJS documents this React Native case (opens in a new window). This second fix was observed with debug profiling, so I do not turn its observations into seconds saved in release.
On React Native 0.86+ with the New Architecture, another option removes this polyfill: hermes-intl (opens in a new window), maintained by useffect.sh, provides Intl.PluralRules, RelativeTimeFormat, ListFormat and Locale natively through ICU4X. There is no JavaScript to load and no detection to run at startup. On iOS, hermes-intl also replaces Intl.NumberFormat (since 0.3.0). On Android, it stays Hermes’s own, which relies on the system ICU.
Imports, rendering, subscriptions: what does the first screen need?
After the polyfills, I looked at the work the dependency tree and components requested at launch, asking each time what the first screen needed that justified it. A rarely visited screen could already trigger module evaluation; a hook reading one property could install several subscriptions.
Which imports and components can wait?
Infrequently used screens were evaluated in the initial import chain. Deferring them reduced work before the home screen. The cost moves to the first navigation to those screens, and the shipped bundle does not shrink. React Native describes these techniques and the risks around module side effects (opens in a new window).
I also separated essential home content from secondary sections. The primary action stays available; secondary blocks mount after the splash screen disappears. That delay must also end if the call that hides the splash screen fails or never returns, otherwise part of the home screen stays empty.
Afterward, I check first navigation, scrolling and deferred content: moving a milestone earlier only to stall the user right after it gains nothing.
Remove unnecessary subscriptions from the first render
A hook reading a single user property installed two profile-data subscriptions. I reduced it to selecting the requested value. Another hook installed subscriptions for every feature-flag consumer even though the computed value was unused.
Those subscriptions have to shrink without breaking data freshness, account switching or experiment-exposure rules.
The measured gains and what they cover
Choose the milestone before comparing
The app's readiness signal matters. One early implementation waited for a decorative animation to finish before declaring the screen ready. Its duration was included even though the user could already act.
The first campaigns tracked a historical signal: splash screen hidden and primary button laid out. It did not establish that all content was ready or that a tap responded.
I then moved the signal to observable conditions: the home screen is focused, the splash screen is gone, necessary data is available, the main element is laid out and the primary action is enabled. A native module then calls reportFullyDrawn(), once per measured launch: that is what produces TTFD. Whether a tap responds is checked separately, with a functional test.
Changing the signal's definition starts a new measurement series. Comparing an old result that includes the animation with a new one that excludes it does not establish an optimization.
The first results
The figures below use the historical signal. Index 100 represents the baseline of each comparison; it does not compare the phones' absolute speed.
| Comparison | Before | After | Observed reduction |
|---|---|---|---|
| Isolated number formatting, entry-level Android | 100 | 78 | 22% |
| Combined initial optimizations, same device category | 100 | 64.5 | 35.5% |
| Combined initial optimizations, newer Android, two comparisons | 100 | 53.3–66.5 | 46.7–33.5% |
The isolated campaign had 40 valid launches in four A/B/A/B blocks, with one Perfetto trace per launch. The combined campaign had 80 valid launches across two devices. Its reductions cannot be attributed to a single PR and do not add up.
These results cannot be compared directly with the later, stricter protocol described below.
Trace the time back to the responsible code
Choosing a fix requires connecting elapsed time to the work causing it. The tools answer complementary questions:
| Tool | Question |
|---|---|
| Macrobenchmark | When do the first frame and readiness signal arrive? |
| Perfetto | Which thread is working or waiting during that interval? |
| Hermes profiling | Which functions and modules consume JavaScript time before the first screen? |
A Hermes capture helps select a correction. Its final effect is measured again without that profiling: instrumented capture durations are not production timings.
When rendering makes a request look slow
I also added milestones for the session, profile, feature flags and home data. Their placement matters: a marker emitted in a React effect comes after rendering work. It can charge that delay to the preceding request. In the benchmark harness, I separated the moment React commits the render from the moment the effect runs.
A “request wait” can include the JavaScript thread's own waiting and processing time. Before blaming the network, compare that wait with native HTTP timing and JS thread activity.
One wait removed, startup unchanged
One experiment used cached feature flags instead of waiting for their network response. Another startup condition became blocking, and the expected improvement did not appear. Tasks overlap, depend on each other and compete for the same thread: their durations do not add up. To prioritize the next change, identify which task still delays the first useful screen.
Caching could also change the variants shown and A/B-test exposure tracking. This remained an experiment, and I kept working on startup workload.
R8 and Baseline Profiles: verify the shipped binary
For both mechanisms, check that they are active in the shipped artifact, then that they improve the milestone you track. Smaller DEX files or a faster first frame do not prove the second point.
R8 enabled, optimizations disabled
R8 (opens in a new window) removes unused Android code, renames symbols and can optimize bytecode. A build may perform the first two while disabling the last.
I worked in stages: a pilot, default enablement, then bytecode optimization. Before AGP 9.0, a -dontoptimize rule shipped by a dependency was enough to disable optimization for the whole app, and that was the case with the project's toolchain. I inspected the merged configuration and added a build-output check. AGP 9.0 now ignores these global options when they come from a library.
Reflection and JNI entry points need targeted keep rules. Validation includes SDK flows and readable crash reports using the exact binary's mapping.
The pilot campaigns showed a favorable TTID signal but no reliable TTFD improvement. The optimization phase reduced binary size; its startup measurements were too variable to conclude. I keep those results separate.
Is ART using the profile packaged in the APK?
Baseline Profiles (opens in a new window) let ART precompile the Android paths described by the profile. They do not directly optimize JavaScript running in Hermes.
I added profile generation and packaging. Finding baseline.prof in the APK is not enough: inspect the final artifact after third-party transformations, then check installation and compilation status. Android provides ProfileVerifier (opens in a new window) for that diagnosis.
The first comparison suffered an interruption and thermal drift. It suggested a favorable first-frame effect without establishing a robust usable-screen gain. I therefore retain no percentage for this one.
A benchmark reliable enough to guide decisions
An A/B comparison only supports a decision if the benchmark harness can distinguish the expected gain from its own noise. I start by comparing the same APK against itself: an A/A control. An A/A with no significant difference is not enough: the confidence interval must also fit within a margin set in advance, for example ±5%. If the harness varies more than the improvement being tested, stabilize it first.
I used Macrobenchmark (opens in a new window) to drive Android launches and retain traces. The benchmark variant follows the release configuration with the required instrumentation added. More intrusive JavaScript profiling runs in a separate session.
Each comparison needs its conditions recorded:
| Item | What I preserve or verify |
|---|---|
| Binary | Revision, APK hash, signature and build configuration |
| Device | Same physical phone, Android version, power connection and unlocked screen |
| Temperature | Thermal state before and after each launch; cooling between series |
| Session | Same test account and data; first launch handled separately |
| Compilation | Explicit ART state, identical between arms unless it is the variable being tested |
| Measurement | Same scenario, markers and readiness definition |
For a returning user, I preserve session and data between launches. Clearing storage each time would also measure onboarding, authentication or an empty cache.
Ten launches give an initial view. Alternating series (A/B/A/B, and in later campaigns A/B/B/A and reversed order) help reveal order dependence. Alternation mitigates some drift without eliminating heating or backend variability on its own. I keep individual samples, each series' median and spread, and reasons for invalidation.
Also verify that the cold start is genuinely process-cold: a service may have recreated the process before the measured launch. I had to discard one isolated campaign on the newer phone for that reason. Asking Macrobenchmark for a cold launch does not replace checking the traces.
Isolate variability without changing the product
The harness distinguished three scenarios:
| Scenario | What it reveals |
|---|---|
| Live network, SDKs active | Complete startup under the test conditions, including their variability |
| Frozen startup responses | Processing the same data while limiting variability in replayed requests |
| Frozen responses, one native SDK excluded from startup | Home-screen work with that source of contention removed |
The last scenario qualified one A/A session on one phone: across 80 launches, the 95% interval stayed approximately between −3% and +3%, within the predeclared ±5% margin. This validated that session's precision, not a product improvement: other SDKs remained active, and the scenario no longer represented complete production startup.
Frozen responses and SDK exclusions belong exclusively to the benchmark build. Any retained optimization must then be reassessed with live networking and active SDKs.
Keep a baseline for the next fix
For another app, I would follow this order:
- Define the conditions that make the first screen useful, keeping TTID separate.
- Produce a release-like build and verify process-cold launches in the traces.
- Qualify noise with an A/A comparison on a physical phone.
- Locate the dominant cost with Perfetto, then JavaScript profiling if needed.
- Change one cause at a time; check deferred content and the first interaction too.
- Repeat with the same protocol, retaining failures and their explanations.
- Track the shipped version by build and device category, alongside crashes and ANRs. Android vitals only reports TTID (flagged from 5 s for a cold start): to track the usable screen in production, send the readiness milestone to your own monitoring tool.
In production, an aggregate metric still mixes users who received the correction with those on the previous version. I inspect the affected builds first, then follow adoption. Production percentiles complement the harness; they are not interchangeable with the median of a few local series.
This is the protocol we apply in the performance part of a React Native app audit. Keeping the harness and traces alongside the code lets the team spot a regression without starting from scratch.
Common questions
Is Hermes enough to make startup fast?
Hermes optimizes JavaScript loading, including through release bytecode. Modules still need to execute, services need to initialize, data needs to be processed, and the screen needs to render. Expensive polyfill detection and unnecessary subscriptions remain work even with Hermes.
Can I measure cold start on an emulator?
An emulator helps validate a scenario and diagnose issues. To claim an improvement on phones, measure on a physical device with a release-like build and documented conditions. Debug instrumentation helps locate costs; it does not establish production startup latency.
Should I clear app data between cold starts?
Not when measuring a returning signed-in user. A cold start requires a new process, not a logged-out account or cleared data. First launch after installation is a separate scenario. Choose and preserve the ART compilation state for each comparison as well.
Are ten launches enough?
Ten launches can form an initial series. They do not guarantee precision. First compare the same APK against itself across multiple series, then increase repetitions or stabilize the scenario if its noise exceeds the improvement you want to detect.
Do R8 and Baseline Profiles speed up JavaScript?
They act on the Android part of the app: DEX code and ART compilation. They do not directly optimize the Hermes bundle. Their effect on the first frame can differ from their effect on when the screen becomes usable.